On this page
- The SEPH Data: What Happened to Canadian Paycheques in July 2026
- Why the Average Canadian Salary Does Not Match Your Paycheque
- Sector Breakdown: The Winners and the Stagnant Industries
- Provincial Realities: From Alberta’s Energy Run to Atlantic Canada’s Wage Acceleration
- The Job Vacancy Equation: Why Hiring Has Cooled While Wages Grew
- A Structured Framework to Benchmark Your Compensation
- Step 1: Calculate Your True Gross Weekly Baseline
- Step 2: Identify Your NOC Code and Regional Range
- Step 3: Audit Your Inflation-Adjusted Purchasing Power
- Step 4: Evaluate Your Total Benefits Package
- Step 5: Check Mandatory Transparency Disclosures
- How to Build a Business Case for a Salary Review
- Documenting Measurable Output
- Framing the Conversation
- Career Positioning: Navigating an Uneven Labour Market
- In brief
- Key takeaways
- Frequently asked questions
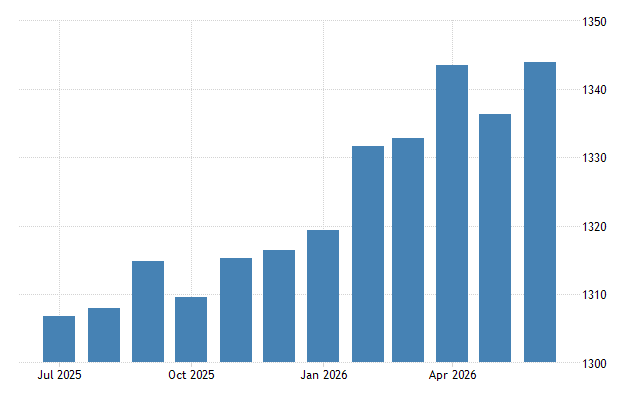
On September 24, 2026, Statistics Canada reported that average weekly earnings in the country hit $1,347.14 for July 2026, according to the Survey of Employment, Payrolls and Hours (SEPH). Wages rose 3.2% compared to July of last year, a slight step down from the 3.4% annual clip recorded in June. Over 52 weeks, that pace translates to roughly $70,051 before taxes and statutory deductions take their cut.
If you open a pay stub in Calgary, Halifax, or Toronto, that headline figure can feel pretty distant from your day-to-day life. Plenty of people look at their direct deposit and wonder where the money went, particularly when a yearly raise barely touched 2% while groceries, insurance, and rent absorbed every spare dollar.
A single national average is always a blunt instrument. It lumps corporate directors in downtown Toronto together with retail associates in Moncton and remote drillers in northern Alberta, grouping industries that are expanding their profit margins with ones shedding staff. Finding out what your work pays in this market takes more than a glance at the headline; you have to break down what the federal data shows underneath.
The SEPH Data: What Happened to Canadian Paycheques in July 2026
While the monthly Labour Force Survey asks households about their employment status, the Survey of Employment, Payrolls and Hours relies on Canada Revenue Agency payroll data alongside a sample of 15,000 businesses. It tracks actual earnings processed through payroll systems for non-farm employees across the country.
Data from the September 24 release shows payroll employment grew by 26,100 jobs (+0.1%) in July 2026. Following three straight monthly gains between March and June, that brought the national payroll workforce up by 171,900 (+0.9%) compared to July 2025.
Gross pay kept moving up as well. Average weekly earnings in Canada rose 3.2% year over year to reach $1,347.14. Meanwhile, average weekly hours for salaried and hourly staff barely budged, landing at 33.4 hours with a 0.3% change over twelve months. That steady workweek shows higher wage rates pushed earnings up, with paycheques growing while hours on the clock stayed flat.
In July, average weekly earnings ($1,347) were up 3.2% on a year-over-year basis. This follows an increase of 3.4% in June. In general, growth in average weekly earnings can reflect a range of factors, including changes in wages, composition of employment, hours worked and base-year effects.
Source: Statistics Canada, Payroll Employment, Earnings and Hours, and Job Vacancies, July 2026
StatCan points out two technical factors behind these totals. First, composition effects alter the math. When businesses lay off entry-level staff, automate junior positions, or hire senior specialists, average weekly earnings rise automatically even if individual workers never received a raise. Second, base-year effects play a role, since the relative performance of July 2025 directly influences the year-over-year percentage.
For anyone planning their next career conversation, context like this matters. A 3.2% national gain reflects an upward shift in the market’s broader wage floor and ceiling, so you cannot assume your current employer has budgeted for automatic, across-the-board raises.
Why the Average Canadian Salary Does Not Match Your Paycheque
Most people get tripped up by headline compensation figures because they treat the average like a median.
An average simply pools every payroll dollar earned across Canada and divides that total by the count of workers on payroll. A relatively small group of commercial bankers, tech executives, and mining superintendents pulling in $300,000 or more drags that number upward in a hurry.
The median sits at the exact midpoint of the workforce, where half of Canadian workers earn more and half earn less. In Canada, median annual employment income runs tens of thousands of dollars behind the annualized SEPH average. That weekly $1,347.14 works out to just over $70,000 annually, yet full-year workers see median individual earnings closer to $48,000 to $52,000, depending on age group and province.
The median wage is preferred over the average wage because it is less sensitive to extreme or anecdotal values and is likely more representative of the typical wages within an occupation.
Source: Government of Canada Job Bank, Questions and Answers on Wages
Job Bank builds its occupational wage outlooks on median numbers for this exact reason, because massive outliers distort the picture. If you run a small logistics warehouse, broad Canadian averages will not help you much. A jump in Ontario utility salaries or executive retention packages in Montreal has no bearing on what a firm in Dartmouth or Red Deer pays for inventory control.
The video below breaks down how these average earnings look across different age groups in the Canadian economy, particularly once deductions take their bite.
There is also the gap between gross numbers and your actual direct deposit. Headline payroll data ignores Canada Pension Plan (CPP) contributions, Employment Insurance (EI) premiums, provincial income tax, and federal brackets. If you earn $1,347 gross weekly in Ontario, your net pay drops to roughly $1,020 to $1,050, depending on employer health benefit deductions and personal tax credits. When rent costs you $2,200 a month, that weekly average gets tight fast. If you want to benchmark your pay against national numbers, you have to start with what actually hits your account.
Sector Breakdown: The Winners and the Stagnant Industries
National averages treat every workplace as though everyone deals with the same economic climate. The July 2026 data shows completely different stories across different industries.
Only eight of the twenty major industrial sectors tracked by Statistics Canada added jobs to their payrolls. Retail trade picked up 3,900 jobs (+0.2%), accommodation and food services gained 3,600 jobs (+0.3%), and professional, scientific and technical services added 2,500 jobs (+0.2%). Real estate and rental and leasing also grew by 0.8%, adding 2,300 payroll positions.
Other sectors pulled those numbers down. Public administration dropped 5,700 jobs (-0.4%), mostly because temporary federal staffing from earlier in the year wound down. Wholesale trade shed 4,100 positions (-0.5%), dragged down once again by machinery and equipment wholesalers.
Here is how weekly earnings and payroll pressures break down across major Canadian sectors:
| Industrial Sector | Typical Average Weekly Earnings | July 2026 Payroll Movement | Key Hiring and Compensation Driver |
|---|---|---|---|
| Mining, Quarrying, and Oil & Gas | $2,500+ | Steady (+1,900 vacancies YoY) | Energy infrastructure projects and remote operational premiums |
| Utilities | $2,300+ | Stable | Highly unionized workforces and power grid capital upgrades |
| Professional, Scientific & Technical | $1,900 - $1,980 | +2,500 payroll jobs | Strong demand in accounting, tax, bookkeeping, and consulting |
| Public Administration | $1,500 - $1,550 | -5,700 payroll jobs | Federal headcount discipline following temporary Census contracts |
| Manufacturing | $1,360 - $1,390 | Soft payrolls, vacancies up | Skilled trades shortages despite broader production softening |
| Retail Trade | $760 - $785 | +3,900 payroll jobs | Lower weekly totals driven by part-time schedules and base hourly wages |
| Accommodation & Food Services | $530 - $550 | +3,600 payroll jobs | High turnover, seasonal fluctuations, and shortest average weekly hours |
Resource extraction still leads Canadian pay by a wide margin. Workers in mining, quarrying, and oil and gas extraction regularly bring home average weekly earnings exceeding $2,500. When energy prices stay high, Western Canadian operations spend capital, which lifts support services, heavy haul trucking, and field engineering right along with them.
Professional, scientific, and technical services held up well, too. Most of the July growth landed in accounting, tax preparation, bookkeeping, and payroll services, which added 2,300 jobs (+1.6%), followed by architectural and engineering services (+2,000 jobs). If you work as a bookkeeper or financial analyst, steady corporate compliance and audit needs keep your function in demand. Meanwhile, computer systems design and related services shrank by 2,000 positions (-0.5%), reflecting tech employers paring back developer headcount while keeping essential architecture roles.
Down at the lower end, you find accommodation and food services ($538.98 in earlier quarterly benchmarks) and retail trade ($773.39). The low weekly total in food service comes down to scheduled time: staff average roughly 22 to 25 hours per week, well below a standard 37.5 or 40. Your take-home pay depends on shifts as much as base pay. In hospitality, a 3% wage increase will not help if your weekly roster gets cut by four hours.
Keep these differences in mind when you review your own compensation. If you want to benchmark your pay against the Canadian average of $1,347, you have to do it within your specific field. Comparing a retail marketing specialist to a pipeline project controller never makes sense.
Provincial Realities: From Alberta’s Energy Run to Atlantic Canada’s Wage Acceleration
Canada operates across ten provinces and three territories with wildly different tax brackets, local industries, and day-to-day costs. The national average of $1,347.14 from July 2026 leans heavily on Ontario and Alberta, even as Atlantic Canada turns in the sharpest wage gains anywhere in the country.
The provincial numbers for average weekly earnings and year-over-year changes from the July 2026 release tell that story:
- Alberta: $1,399.61 (+2.5% YoY)
- Ontario: $1,391.19 (+3.6% YoY)
- British Columbia: $1,356.78 (+4.4% YoY)
- Saskatchewan: $1,325.24 (+4.4% YoY)
- Newfoundland and Labrador: $1,317.98 (+1.7% YoY)
- Quebec: $1,279.96 (+1.9% YoY)
- New Brunswick: $1,261.88 (+5.3% YoY)
- Nova Scotia: $1,228.91 (+5.6% YoY)
- Manitoba: $1,217.11 (+3.1% YoY)
- Prince Edward Island: $1,207.99 (+4.1% YoY)
The territories sit in a category of their own, shaped by severe living expenses and fly-in resource projects. Average weekly earnings reached $1,844.70 in Nunavut (+2.3%), $1,821.38 in the Northwest Territories (+4.8%), and $1,504.26 in Yukon (+1.1%).
The Maritimes show the clearest acceleration. Nova Scotia topped every province with a 5.6% year-over-year jump in weekly pay, New Brunswick hit 5.3%, and Prince Edward Island climbed 4.1%. Atlantic Canada used to offer a substantial pay discount next to central Canada. That gap has shrunk under the pressure of steady population influxes, a thinner local talent pool, and higher starting wages.
Alberta and Ontario still post the largest nominal paycheques among the provinces. Alberta came in at $1,399.61, backed by natural gas, oil sands extraction, and incoming skilled trades. Ontario followed closely at $1,391.19, helped by head-office jobs in Toronto alongside southwestern advanced manufacturing. Still, Ontario lost 10,700 job vacancies in July. Established staff are doing fine on paper, but teams are hiring with far more hesitation.
The video below breaks down how household earnings match up against regional expenses, showing how higher gross pay often evaporates once local overhead takes its bite.
Quebec posted slower growth at 1.9%, finishing at $1,279.96. Cheaper public programs for child care and post-secondary tuition balance out some of that difference, which is why raw dollar comparisons between provinces rarely tell the whole story. We walk through how these structural costs influence careers nationwide in our guide to cost of living in Canada.
The Job Vacancy Equation: Why Hiring Has Cooled While Wages Grew
A 3.2% year-over-year wage increase might suggest companies are scrambling to hire, but Canadian businesses are keeping payrolls tight. July 2026 data shows 501,000 job vacancies across the country, a count that sat practically unchanged for seven consecutive months. The job vacancy rate, measuring unfilled postings against total labour demand, held flat at 2.8%, hovering between 2.7% and 2.8% since April 2025.
At 2.9 unemployed persons for every open role, the unemployment-to-job vacancy ratio improved slightly from last year, dropping by 0.3. That movement came entirely from the national unemployment rate falling from 6.9% to 6.4%.
Canadian labour economists call this a low-turnover, low-hire market. Companies are holding onto their experienced people because recruiting and training mid-level specialists is expensive and tedious. To prevent staff from walking, employers are handing out targeted merit increases, which keeps average weekly earnings drifting up. Headcount expansion, on the other hand, is off the table. When an employee leaves, hiring managers scrutinize whether duties can be redistributed internally before they even consider an external posting.
Your leverage in this market comes down to whether you are already on staff:
- For currently employed professionals: You have room to negotiate retention pay if your daily work directly supports core operational revenue or regulatory compliance.
- For active job seekers: Prepare for drawn-out interview rounds, stiffer competition for open postings, and employers who take their time to make an offer.
Regional numbers show an even sharper contrast. Alberta added 7,700 vacancies in July 2026 to reach 73,100, its highest vacancy level in nearly two years, while Manitoba added 2,200 openings. At the same time, postings fell in Ontario (-10,700) and Quebec (-8,000). Job seekers need to evaluate their prospects against local demand, because national totals hide what is happening in their own province.
A Structured Framework to Benchmark Your Compensation
Now that you know how the national and sector numbers look, you need a practical way to see whether your own paycheque is keeping pace. Skip the anonymous wage forums and do not compare yourself to a former colleague who moved down to Silicon Valley. You will get much clearer answers by pulling reliable figures from Canadian labour data.
Step 1: Calculate Your True Gross Weekly Baseline
Pull out your last three pay stubs. You need your gross earnings before taxes, CPP, and EI deductions. The take-home deposit in your chequing account hides those amounts. Exclude one-time performance bonuses, expense repayments, and irregular overtime, unless regular overtime is written into your employment contract.
Divide your annual base salary by 52, or multiply your standard hourly rate by your regular weekly scheduled hours. If your annual base is $68,000, your gross weekly earnings come out to $1,307.69. That leaves you about $39.45 below the July 2026 national aggregate of $1,347.14.
Step 2: Identify Your NOC Code and Regional Range
The national aggregate gives you a broad benchmark, but your National Occupational Classification (NOC) code gives you actionable intelligence for your specific career path.
Visit the federal government’s Job Bank wage search tool and type in your job title and economic region. Job Bank tracks three specific wage points for occupations across each economic zone: low, median, and high.
- The low figure reflects entry-level pay, junior staff, or smaller independent employers.
- The median reflects experienced workers carrying out standard responsibilities without direct supervision.
- The high figure represents senior specialists, team leads, or roles within well-paying industries such as energy and financial services.
If you are an operations supervisor in Edmonton making $34.00 an hour, looking up occupational databases like Government of Alberta ALIS will clarify whether your pay matches the provincial median or sits behind local peers.
Step 3: Audit Your Inflation-Adjusted Purchasing Power
Pay increases only build financial ground if they outrun consumer inflation. If your earnings went up 2% over the past twelve months while your provincial Consumer Price Index rose 2.8%, your real purchasing power dropped.
Check how your earnings have shifted over a rolling 24-month and 36-month window. If you began a position in 2023 at $62,000 and your salary in 2026 is $65,000, your pay increased by 4.8% over three years. During that exact stretch, national average weekly earnings grew by more than 9%. That gap shows that your company’s annual merit review is falling behind the broader market.
Step 4: Evaluate Your Total Benefits Package
Base pay is only one side of your compensation. When employers cap salary bands, they often use non-wage perks to make up the difference.
Review what your employer provides for:
- Registered Retirement Savings Plan (RRSP) matching percentages.
- Extended health, dental, and paramedical coverage limits.
- Extra paid vacation days beyond provincial statutory requirements.
- Flexible or remote work arrangements that save thousands of dollars every year in vehicle fuel, transit, or parking costs.
An employee earning $1,300 gross per week with a 5% RRSP match and four weeks of paid vacation often sits in a better financial spot than someone making $1,360 per week with zero employer match and statutory minimum time off.
Step 5: Check Mandatory Transparency Disclosures
Several Canadian provinces now enforce pay transparency rules that require employers to state salary bands on public job postings. If you work in British Columbia or Ontario, check recent job listings from direct competitors hiring for your exact position.
These mandatory postings give you clear figures based on what employers currently pay new hires. We explain how these rules work in our guide to pay transparency in Canada.
How to Build a Business Case for a Salary Review
When an audit confirms your pay lags behind national, sectoral, or occupational medians, the reflex is to book twenty minutes with your boss and ask for a bump.
Hold off on sending that calendar invite for a second.
Personal living costs will not win this argument. Telling a manager your mortgage renewed at a higher rate, car insurance jumped, or StatCan SEPH figures show national wages grew 3.2% will not open up department funds. Canadian employers set compensation strictly by operational output and the cost of replacing you.
To get a real adjustment when hiring has slowed down, build the case around your impact on operations and what it would cost the company if you walked away.
Employers who want to hire you expect that you might want to negotiate the terms of your employment before you accept the job, especially if you have valuable skills.
Source: Government of Alberta ALIS, How to Negotiate Your Job Offer
That rule holds for an annual review just as much as an external offer. Managers respond well to people who know their market numbers and discuss them without getting emotional.
Documenting Measurable Output
Bring a one-page summary of what you delivered over the past 12 to 18 months into the room. Group your wins into three buckets:
- Revenue and Efficiency Gains: Did you fix a broken reporting process and save team hours every month? Did you save an at-risk client account, or catch billing mistakes that preserved cash?
- Expansion of Scope: Are you handling duties that belonged to someone who left or were once reserved for a senior role? Absorbing work beyond your original job description is the clearest reason an employer has to bump you into a higher salary band.
- Institutional Reliability: In a slower job market, reliability carries real weight. Running your desk day to day with minimal supervision saves your manager grief and keeps the team steady.
Framing the Conversation
Pick your moment. Catching your manager after a rough quarterly earnings call or mid-stride in a chaotic weekly meeting will backfire. Instead, ask for time when leadership is drafting departmental numbers for the upcoming fiscal quarter.
Send a brief email ahead of time. Keep the tone straightforward: explain that you want to walk through your recent contributions alongside current market rates for your role. Giving advance warning lets your manager talk to HR or check salary bands before sitting down with you.
Present the numbers plainly during the discussion. If your manager agrees you are underpaid but points to temporary company-wide budget freezes, pin down a timeline: “If budget caps prevent an adjustment this quarter, what specific milestones do we need to hit to review this again in three months?”
If you decide to interview externally to check what the market actually offers, review how to negotiate a job offer in Canada so you can make your case without risking the opportunity.
Career Positioning: Navigating an Uneven Labour Market
The September 24 StatCan report shows a Canadian workforce that is split. Wages grew at a steady 3.2% clip, while hiring stayed cautious and job openings remained selective.
Sitting tight and waiting for an automatic annual raise is risky, especially if you work in an industry that is shedding payroll, like wholesale distribution or parts of general manufacturing.
Your best hedge is building skills that carry over into other fields. Financial modeling, technical project coordination, data governance, and regulatory compliance are in demand whether an employer sells industrial equipment, runs health clinics, or builds infrastructure.
If you are deciding between holding onto a steady role and jumping into independent consulting, weigh the tradeoffs in our guide to contract vs full-time jobs in Canada. Contract roles often deliver higher hourly pay that runs ahead of SEPH averages, but you take on your own health coverage, tax installments, and unpaid bench time between contracts.
Keep your materials current, too. If you have not touched your resume or public profiles in years, an objective resume assessment can show you where you are underselling your achievements to Canadian hiring teams.
A rising national average weekly earnings figure is an encouraging macroeconomic signal. It shows Canadian payrolls are expanding in dollar terms and employers are still putting money into their staff. Benchmark your pay against the data, watch your regional industry shifts, and bring clear evidence to your next review.
Key takeaways
5
- Average weekly earnings in Canada rose 3.2% year over year to reach $1,347.14 in July 2026.
- Median individual annual employment income in Canada sits between $48,000 and $52,000, trailing the annualized average of roughly $70,051.
- Mining, quarrying, and oil and gas extraction led all sectors with weekly earnings exceeding $2,500, while accommodation and food services remained the lowest.
- Nova Scotia recorded the fastest wage growth at 5.6%, while Alberta and Ontario maintained the highest nominal weekly averages.
- Canadian employers held job vacancies flat at 501,000 in July 2026, creating a low-turnover environment focused on retaining current workers.
Frequently asked questions
5
What caused average weekly earnings in Canada to reach $1,347 in July 2026?
Higher wage rates drove average weekly earnings to $1,347.14 as average weekly hours remained steady at 33.4 hours. Statistics Canada identified composition effects, such as reducing entry-level roles or hiring senior specialists, alongside base-year comparisons as technical factors contributing to the 3.2% annual growth. The Survey of Employment, Payrolls and Hours recorded a total payroll expansion of 26,100 jobs during the month, which brought twelve-month workforce growth to 171,900 payroll positions.
Why do average Canadian weekly earnings differ from typical take-home pay?
Outliers at the top of the income spectrum skew the national average far above median earnings. A small share of high earners pulls the national payroll average upward, while Canadian median annual employment income sits between $48,000 and $52,000. Furthermore, gross headline earnings exclude mandatory payroll deductions. Standard contributions for the Canada Pension Plan, Employment Insurance premiums, and income taxes reduce a $1,347 gross weekly amount in Ontario to approximately $1,020 to $1,050 in direct deposits.
Which Canadian industrial sectors pay the highest weekly earnings?
Mining, quarrying, and oil and gas extraction leads Canadian weekly earnings with figures regularly exceeding $2,500 per week. Utilities follows with average earnings exceeding $2,300, supported by union contracts and capital projects. Professional, scientific, and technical services also pays above the national average, recording weekly totals between $1,900 and $1,980. Conversely, accommodation and food services generates the lowest weekly figures at roughly $530 to $550, primarily because of shorter weekly work schedules.
How did provincial wage growth compare across Canada in July 2026?
Atlantic provinces posted the fastest annual wage acceleration, led by Nova Scotia at 5.6% and New Brunswick at 5.3%. Alberta and Ontario maintained the highest nominal earnings among provinces at $1,399.61 and $1,391.19 respectively. British Columbia and Saskatchewan each recorded 4.4% year-over-year gains. Quebec saw slower growth at 1.9%, finishing with average weekly earnings of $1,279.96, while territorial earnings remained highest overall, reaching $1,844.70 in Nunavut and $1,821.38 in the Northwest Territories.
How can Canadian workers effectively request a salary adjustment?
Workers can prepare for a salary review by presenting documented operational contributions to the company. Effective proposals group accomplishments into revenue gains, expanded job scope, and institutional reliability over the prior 12 to 18 months. Employees should benchmark their base earnings using the federal Job Bank wage tool and provincial pay transparency postings before initiating discussions. Advance notification allows management to assess departmental budgets and compensation bands before the scheduled meeting.
More From the Blog
New LMIA Rules in Canada: What the Staffing Agency Ban Means
ESDC's new LMIA rules in Canada ban staffing agencies from placing foreign workers at client sites. Here is what direct hiring means for...
Read the articleHow Nainly Works: The 17-Step Career Marketing Campaign, Explained Step by Step
Learn how Nainly works step by step. Explore the complete 17-step career marketing campaign, from ATS optimization to Canadian hidden job...
Read the articleHow to Conduct an Informational Interview in Canada: A Step-by-Step Tutorial
Master every step of an informational interview in Canada, from cold outreach scripts to coffee chat etiquette that uncovers hidden job...
Read the articleReady to Launch Your Career Marketing Campaign?
Book a strategy call and see how Nainly can transform your job search.
Schedule a CallFree consultation. No commitment.